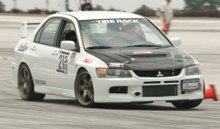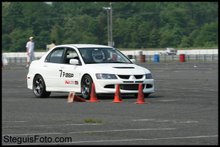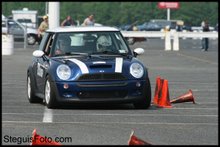
check it out.. warminster inspired him to design a pretty fast course..
i think the data aq has helped me get faster. i know i needed to use more of the car's grip in the slower speed transitions and i've applied it today. i 'would' have won by 3 tenths had i not coned it away...
Here's our fast run data. I was faster by 3 tenths in this overlay. click the pic for a full size image.

'qview' is what maxQ calls this type of data display.
- the width of the rectangles denote the amount of lat g pulled
- height of rectangles, longitudinal g.
- green denotes where i was faster compared to perry, yellow slower.
- now the extremely useful data is the blue and red shading. blue is accel, red decel. take a look where our brake and accel point are to see why i might've been faster in one section, or slower. white indicates neither accel nor decel. pretty friggin cool!
some data you can't see on the graph
average mph: dan 42.6mph, perry 42.2mph
peak lat g*: dan 1.07g, perry 1.01g
*'street' tires!
perry is badass.. he hopped in my car having never driven the setup, and was immediately super quick. sick!
looking forward to the next nnjr event..
-dan